Everything happens somewhere. How does the Northern Ireland Assembly’s in-house geographic information service help Members analyse and visualise complex data?
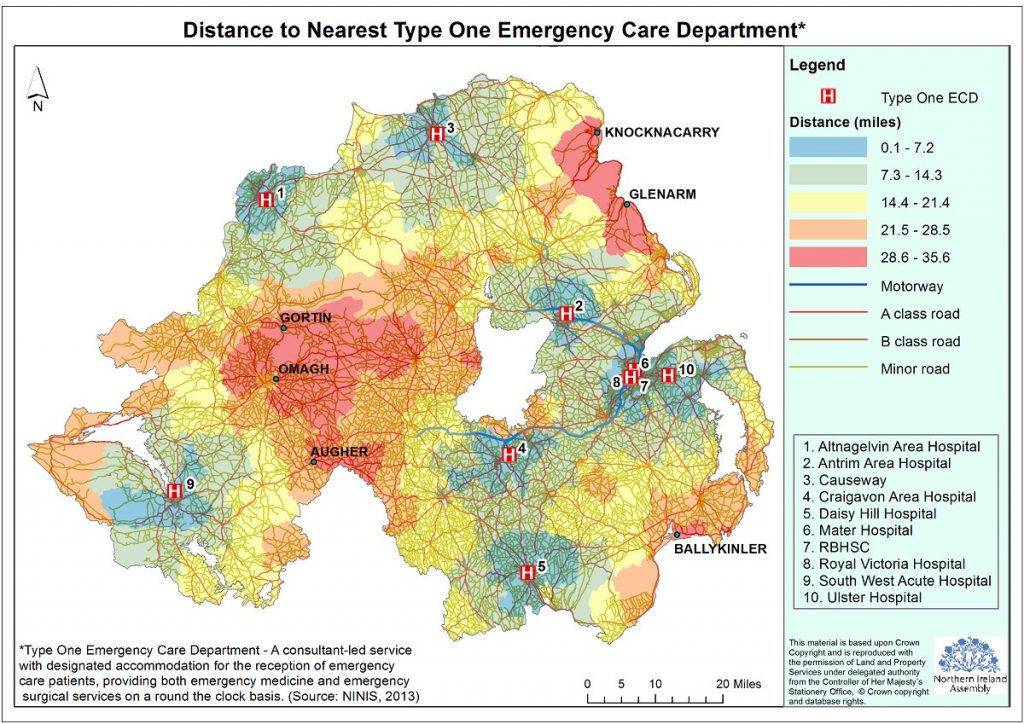
Over 80% of data used by our public sector services – environment, health, education, security, construction, transport, agriculture, heritage, sport and employment – has a geographic element e.g. an address or a coordinate. All these can be mapped. The advantage of mapping information rather than producing a table of information is that it allows users to easily review, analyse, visualise and understand previously unseen patterns, gaps, issues or problems. Analysing data in this way can lead to improved decision making. Examples of the kinds of geographical analysis produced by the Research and Information Service can be seen in figures 1 and 2.
Figure 1 shows the road distance patients need to travel to reach their nearest Type 1 Emergency Care Department. The patients living in the red areas have the furthest distance to travel; 28.6 – 35.6 miles.
Figure 2 displays two sets of boundaries on a single map allowing a direct comparison to be made. The Local Government Districts (Order 1993) are outlined in black, whilst the Local Government Districts (Order 2012) are symbolised using different colours.
The Northern Ireland Assembly has access to Ordnance Survey Northern Ireland digital mapping data and has a dedicated Geographic Information Consultant within the Research and Information Service (RaISe) to assist Members. Maps can be customised and emailed directly to Members.
We also provide an interactive map gallery available via AssIST (the Assembly’s intranet) and the public website (see also figure 3); allowing Members to filter data, zoom into areas of interest and add or remove map data. The map gallery contains a bank of maps that may be of use to Members for their constituency business. Maps include: crime and anti-social behaviour rates by ward, locations of various public services, demography and distribution of funding. Members can receive customised maps on request.
Members can also make their own interactive maps using Spatial NI, an online mapping service created by Land and Property Services (see figure 4). The Spatial NI website guides users through a simple step-by-step process in making their own map. There is a wealth of mapping data to choose from.
The range of geographic information services provided by RaISe includes:
- Custom made interactive and static maps (in digital format);
- Training in geographic information systems;
- Constituency profiles;
- Provision of Ordnance Survey Northern Ireland historic mapping;
- Calculation of travel times and road distances;
- Finding catchment areas of services;
- Mapping census results by constituency and ward;
- Comparing change over time, e.g. demographics;
- Mapping of boundary changes; and
- Mapping of services and public transport in rural areas.