How were resources allocated to the nine Executive departments, and how much did they get?
On 13th January 2016 the Minister of Finance and Personnel published the Executive’s single year Budget 2016-17, bearing in mind the new nine-department structure which is now effective following the Assembly’s May 2016 elections. The Budget is to provide the incoming Ministers forming the new Executive with a ‘…stable, balanced platform to determine priorities and funding allocations post May elections for a multi-year Budget from 2017-18 to 2019-20’.
Budgets for the new departments were developed by combining the budgets for each function within the old departments. These were then allocated to form a baseline for the new departments. Each baseline was derived from the budget position at the start of 2015-16, with time-bound allocations removed, (e.g. European Union Match Funding and Department of Justice Security Funding).
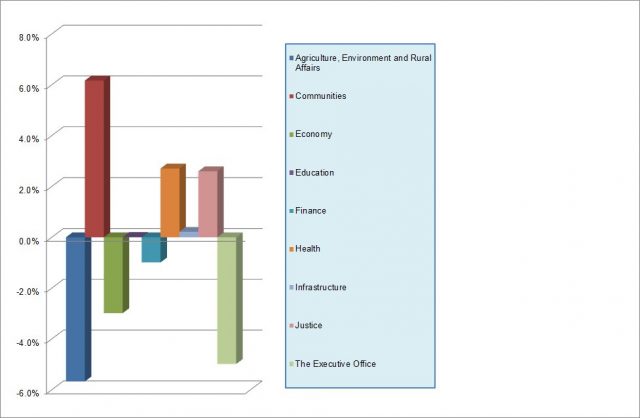
Figure 1 shows percentage changes from baseline to 2016-17 allocation in Resource DEL (Departmental Expenditure Limits).

It is useful to note that some departments have provided indications of how the headline figures may be sub-divided (i.e. distributed within the department). Table 2 shows the five largest budget headings (which departments sometimes call ‘budget lines’). In total, these account for nearly £7 billion of Budget 2016-17.
Readers should note, however, that newly appointed ministers may use the Executive’s June 2016 Monitoring Round – to a greater extent than usually permitted – to move funding between budget lines. For this reason, the allocations to budget lines should not be viewed as final.
Table 1: Largest Resource DEL budget lines 2016-17
|
Budget line
|
Department
|
Budget 2016-17 (£m)
|
|---|---|---|
| Hospital Services | Department of Health |
2,734.70
|
| Schools Mainstream | Department of Education |
1,907.90
|
| Social Care | Department of Health |
982.6
|
| Safer Communities | Department of Justice |
746
|
| Employment and Social Security | Department for Communities |
504.7
|
|
Total
|
6,875.90
|
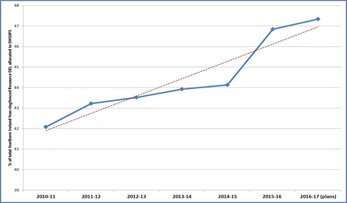
At lines 1 and 3 of Table 1, it can be seen that Health and Social Care uses a remarkably large proportion of the Executive’s resources, meriting close Assembly scrutiny. As Figure 2 below highlights, over recent years this proportion has increased:
Figure 2: Proportion of Non-ringfenced Resource DEL allocated to Health

Increasing health expenditure is a budgetary feature in all industrialised countries. The reasons for this are complex, but not simply due to population ageing. According to the OECD, more significant factors are new technologies and rising incomes. The OECD argues that health expenditure is the hardest area in which to contain costs. In consequence, other competing departmental budgets are put under pressure.
Over the next Assembly mandate, debate is likely to continue about how the Executive will seek to strike appropriate balances when making difficult expenditure allocation decisions given tighter budgets. Contributions from the Assembly will help to inform that decision-making process. One of the Assembly’s challenges in doing this will arise from departmental reorganisation, which will necessitate the tracking of movements in budgets from the old structure to the new.

