Please note that the Constituency Profiles have been updated with a new layout and are available on a new page here.
The Research and Information Service (RaISe) has just produced updated 2016 Constituency Profiles for each of the 18 constituencies in Northern Ireland. This article looks at why and how these profiles are produced.

First published in 2010, Constituency Profiles are produced by the statistics team within RaISe on an annual basis. They were originally developed in response to the fact that statistical requests from Members representing constituencies across Northern Ireland tended to ask for the same kinds of information – the population of the constituency, educational achievement, the unemployment count, the crime rate and so on. By developing Constituency Profiles, RaISe was able to respond to this demand while at the same time creating a mechanism whereby all Members and their support staff could have access to statistical information about their area.
Constituency Profiles provide a range of statistics including demographic information and indicators of health, education, employment, business, low income, crime and road traffic accidents for each constituency.
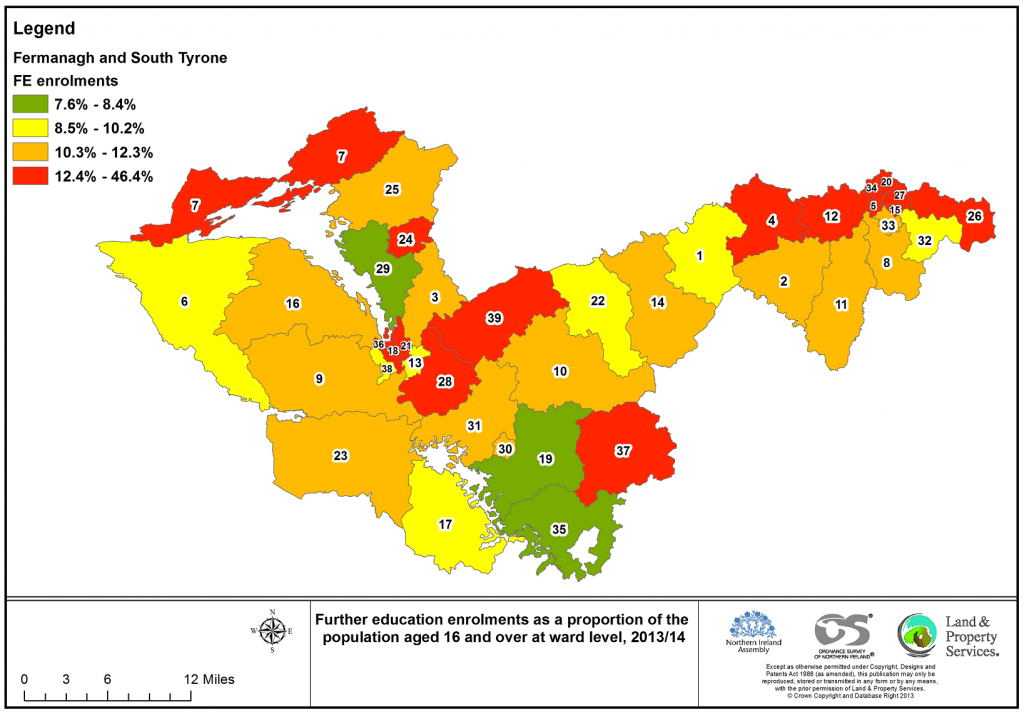
Summary tables show the latest data for each indicator as well as data for the previous year or period and change over time. For each indicator, the profiles present the most up-to-date information available at the time of writing; how the constituency compares with the Northern Ireland average; and how the constituency compares with the other 17 constituencies in Northern Ireland. For a number of indicators, ward level data is provided demonstrating similarities and differences within the constituency. Ward data is illustrated by maps produced by our Geographic Information consultant.
The information used to produce the reports is obtained from the Northern Ireland Statistics and Research Agency’s Northern Ireland Neighbourhood Information Service (NINIS). NINIS makes small area information held within Central Government and Non-Departmental Public Bodies publically available. The NINIS website includes datasets on a range of socio-economic themes at small-area statistical geographies. Constituency Profiles use this excellent resource and draw together constituency-level information into one place.
The indicators are intended to provide a flavour of the information available on NINIS rather than an exhaustive list of all constituency-level data on the website. Members are always welcome to request information from RaISe if there is something that they need that is not included in the reports. The team are open to new ideas for inclusion in the profiles from Members and stakeholders too. For example, crimes with a domestic violence motivation were included in the profiles for the first time this year.
Feedback from Members and their support staff about the profiles has been very positive, including regarding their usefulness in facilitating constituency work. In terms of hits, Constituency Profiles are one of the most popular products on the RaISe section of the Assembly website.
The updated June 2016 Constituency Profiles are now available on the Assembly website.