This two-part blog post is a follow-up to a series of three articles about Outcomes Based Accountability (OBA) and the Programme for Government (PfG) draft Outcomes Framework published recently.
Part 1 considers the changes to culture and heritage related outcomes in the draft PfG, published in January 2021. Tomorrow, part 2 will explore different approaches to valuing culture and heritage and considers the potential of these metrics as methods for scrutinising the value of future culture and heritage policies.
How can we measure if wellbeing has improved?
The opening line to the Programme for Government (PfG) draft Outcomes Framework consultation document is:
The Executive is united in its aim to improve the wellbeing of all of our people.
In Northern Ireland, an Outcomes Based Accountability (OBA) system has been used to monitor the progress of our Programme for Government (PfG) since 2016. Similar to Scotland and Wales, Northern Ireland used the OBA system to define agreed outcomes. These outcomes are ‘conditions of wellbeing’ for a given population. The outcomes based accountability framework is designed to help demonstrate progress towards the achievement of both personal and collective wellbeing. As outlined by researchers in 2014, the benefits cultural activities generate for society are difficult to measure and value, ‘…and can therefore get neglected or completely ignored in discussion about how best to allocate scarce resources’.
Defining and measuring wellbeing
Wellbeing is defined and captured in multiple ways. The Office for National Statistics (ONS) has been collecting information on personal wellbeing since 2012. It defines personal wellbeing measures as:
Our personal wellbeing measures ask people to evaluate, on a scale of 0 to 10, how satisfied they are with their life overall, whether they feel they have meaning and purpose in their life, and about their emotions (happiness and anxiety) during a particular period.
Within the ONS dashboard of National Wellbeing Measures, individual arts and culture participation as well as satisfaction with leisure time are measured. In Northern Ireland, these questions are asked as part of the Continuous Household Survey.
At the societal level, ONS measures social capital based on a 25 indicator framework produced by the Organisation for Economic Co-operation and Development (OECD). This covers social network support, trust, civic participation and personal relationships. In Northern Ireland, the Continuous Household Survey asks questions relating to social capital. This includes individual perceptions of the local area, trust in people in the area and action taken to solve problems affecting local people. The social capital datasets available on NISRA’s website are from 2005/06.
In December 2020, Carnegie UK called for the measurement of Gross Domestic Wellbeing as a single figure for collective wellbeing. Their report suggested that although the ONS wellbeing data offers a good starting point, there are gaps. The gaps identified by Carnegie UK included measurements being collected from surveys that only cover private households and therefore miss information about people who are homeless, in residential care or live in caravans. Also, the time delay between collection and publication can hamper policy decisions and that the methods used should be reviewed continuously. Also, the suggested measures for participation in cultural and heritage activities are the same as those currently used.
Measuring wellbeing to understand social progress
When scrutinising funding for culture related initiatives, a frequent question is ‘how do we know if the public money spent on these initiatives made a difference?’.
The difficulty in answering this question, may be due in part to the two levels of accountability in the OBA system. One level is the collective or societal population accountability and the other, the individual performance accountability.
When developing population level outcomes, policy makers use the following seven questions:
1. What are the quality of life conditions we want for the children, adults and families who live in our community?
2. What would these conditions look like if we could see or experience them?
3. How can we measure these conditions?
4. How are we doing on the most important measures? (baselines and causes)?
5. Who are the partners that have a role to play in doing better?
6. What works to do better, including no-cost and low-cost ideas?
7. What do we propose to do?
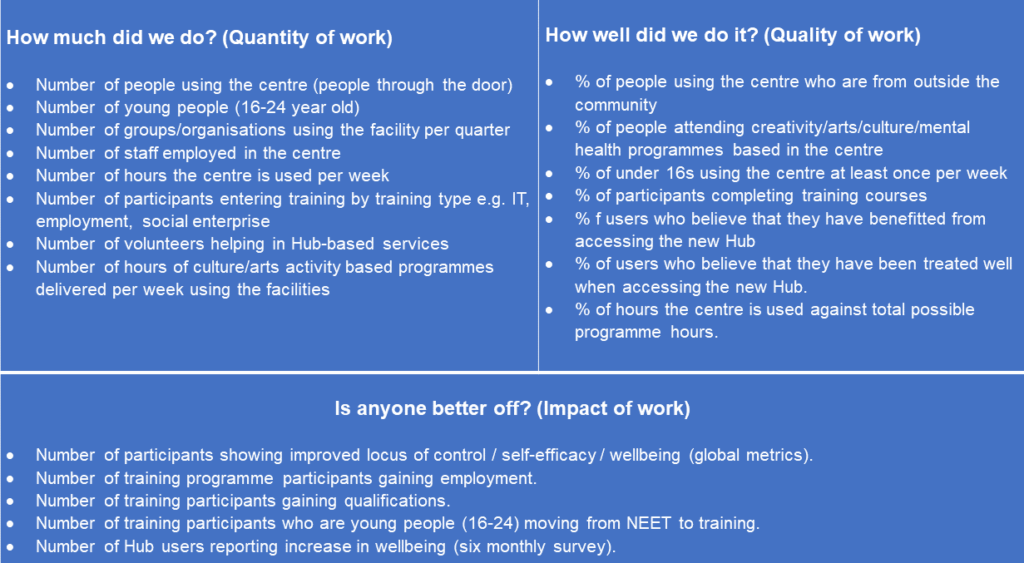
Where the PfG is based at the higher population accountability level, the contribution of individual departments, agencies and stakeholders towards the PfG outcomes, is assessed using performance accountability. Performance accountability focuses on defining and measuring progress for an individual group, for example; attendees of a community arts hub, supported by the Arts Council of Northern Ireland (ACNI). For OBA, there are three questions policy makers use to determine performance measures:
- How much did we do?
- How well did we do?
- Is anyone better off?
Outcomes based report cards are sometimes used by Executive departments to manage this process.

It is the performance accountability data that may be of most value to Committees and the media. However, a potential issue for consideration, is using performance accountability data e.g. number of young people that took part in an Arts Council training programme, to understand progress towards a population level outcome, such as ‘everyone can reach their potential’. Although the performance of individual programmes can contribute to progress, the relationship between the two measures is not ‘cause and effect’. Therefore, an arts programme that achieves its projected attendance figures, does not necessarily indicate that the impacts from arts participation for this individual group caused progress towards the overall outcome.
In 2014, a Commission on Wellbeing and Policy recommended that if we make improved wellbeing a policy goal, data on wellbeing must be collected and used. Also, we need to understand the multitude of factors that cause wellbeing. The Commission suggested using models to more holistically capture the different causal effects on wellbeing. More information and analysis is needed beyond the frame of analysis which OBA provides. As concluded in a 2018 RaISe article Measuring museum success: How and why?, although we appear to have lots of data about our heritage (and indeed cultural assets), it is not clear what we are trying to measure, nor how measures currently gathered relate to ‘success’. As discussed in part 2 of this series, the measurement of wellbeing is in its infancy.
Limitations of OBA
Limitations of the OBA system can also arise when input/output quantitative data is used to define and measure impact. As outlined in a recent article by RaISe about performance accountability, ‘this can encourage the production of the right data, over delivery of the right services and simplify the complexity of real-life interventions‘. This is sometimes referred to as ‘perverse incentives’. The use of ‘vanity metrics‘, such as the number of participants attending an event or the number of followers on social media, does not give much insight about the impact that engagement had, such as whether participants gained qualifications or employment (i.e. is anyone better off?). And it can be difficult to attribute responsibility for success. If a digital skills training programme secured employment for 30 participants – how can we know how many of those people would have gained employment anyway?
At the population level, a PfG Technical Assessment Panel (TAP) has been established, in part to deal with the potential of perverse incentives at population indicator level.
How might the outcomes-based framework capture the value of cultural activities in NI?
In the PfG published in 2016, two of the 10 outcomes directly related to culture. The outcomes are purposefully broad and aspirational and the supporting indicators give definition and measure progress towards each outcome. One indicator specifically mentioned arts/cultural activities. However, the Department for Digital, Culture, Music and Sport has previously reported that when measuring the value of cultural assets, a range of both quantitative and qualitative methods should be used to create a robust evidence base for decision making and that a cross-disciplinary approach is also needed, given the quantifiable health, educational, economic as well as civic participatory benefits of cultural activities.
In the 2016-2021 PfG, the population outcomes related to culture and heritage included:
| Outcome | Indicator | Action |
| We are an innovative, creative society, where people can fulfil their potential. |
|
Encouraging the take up of arts, cultural and sporting activities – recognising the benefits that flow from engagements in these areas in terms of good health, mindfulness and satisfaction with life. |
| We are a shared, welcoming and confident society that respects diversity.
|
|
Supporting creative industries, oversight and delivery for the arts, cultural and language sectors. The culture, arts and language sectors play an important part in promoting cohesive communities to help the achievement of positive health and socio-economic outcomes. |
The dataset used to monitor progress on cultural indicators at a population level was NISRA’s Continuous Household Survey questions about culture, art and sport engagement, which included questions about the benefits of engaging in cultural activities, mentioning good health and wellbeing.
Draft PfG
In the latest draft Programme for Government published in January 2021, of the nine outcomes, two referred to culture and heritage. These included:
| Outcomes | Key Priorities |
| People want to work, live and visit here | Providing access to sports, arts and culture and encouraging and facilitating opportunities for people to get involved. |
| Promoting built heritage, eco-tourism and outdoor recreation. | |
| Providing spaces and facilities for sports, arts and culture events and activities to take place. | |
| Everyone can reach their potential | Supporting creative industries, oversight and delivery for the arts, cultural and language sectors. |
| Promoting cohesive communities through the culture, arts and language sectors. |
Indicators were not published with the 2021 draft programme for government, instead ‘Key Priorities’ were included, as well as a list of relevant policies. ACNI’s response to the draft PfG consultation, stated that ‘the arts are too narrowly defined’ and suggested changing ‘People want to work, live and visit here’ to ‘Attracting and retaining creative talent is a key factor for economic competitiveness in the years to come. This places particular emphasis on the quality of place: in particular, access to sports, arts and culture and the outdoors.’
In email correspondence, TEO officials explained to RaISe that:
[…] following a review of lessons learned (incorporating feedback from stakeholders and users), a technical evaluation of the current 49 indicators and an international comparison exercise, a suite of population indicators is being developed with a view to demonstrating progress on Outcomes in a way that’s meaningful to everyone with due regard to equality of opportunity and good relations.
At the time of writing, population indictors had not yet been published. Therefore, the second blog post in this series explores how culture and heritage policy makers elsewhere are developing wellbeing measures to specifically help ‘value’ culture and support the scrutiny of future policies and their value for money.

